

JUNK Relief is a Chicago junk removal company, and since the summer of 2020 our crews have finished 30,784 jobs across the city and the suburbs. Every job starts with a short note from our office: what's going, where it is, and anything the crew should know before they knock. We read through all of them to see what they say about how Chicago lives, moves and makes room. Here's what we found.
Couches, every single day
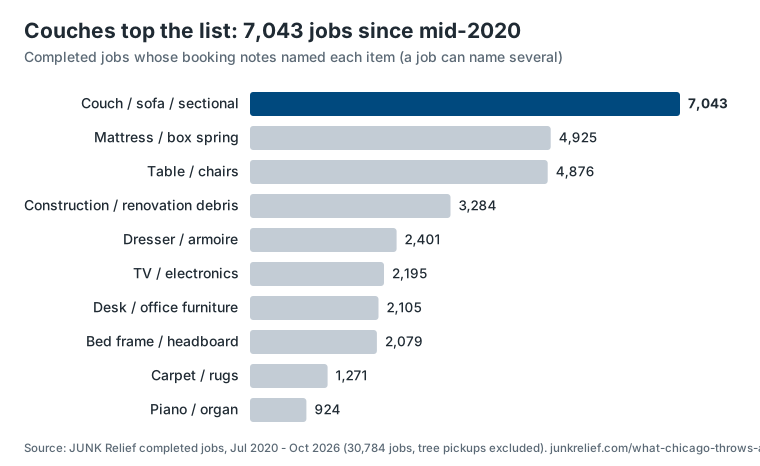
The couch is the undisputed king of Chicago junk. 7,043 of our jobs included a couch, sofa, sectional, loveseat or futon. That works out to about three couch pickups a day, every day, for more than six years.
Mattresses and box springs come next, on 4,925 jobs, followed closely by tables and chairs (4,876). After that come construction and renovation debris (3,284 jobs), dressers (2,401), TVs and electronics (2,195), desks and office furniture (2,105) and bed frames (2,079).
There's a reason big, soft, awkward furniture leads the list. It doesn't fit in the garbage cart, it rarely fits in the car, and it's usually at the top of a staircase. And when a couch truly won't fit through the door, the crew takes it apart right there and carries it out in pieces. It happens more often than you'd think.
The city clears bedrooms; the suburbs clear backyards
Where you live changes what you let go of.
In downtown ZIP codes (the Loop, River North, Streeterville, the Gold Coast, the South Loop and the West Loop), a quarter of our jobs (25.2%) included a mattress or box spring. In the suburbs, it's 9.5%. A mattress is the one thing almost nobody wants to bring to the next apartment.
High-rise living comes with its own logistics, too. One in five downtown jobs (20.6%) needed an elevator reservation or a loading dock time slot. In the suburbs, that number is 1%.
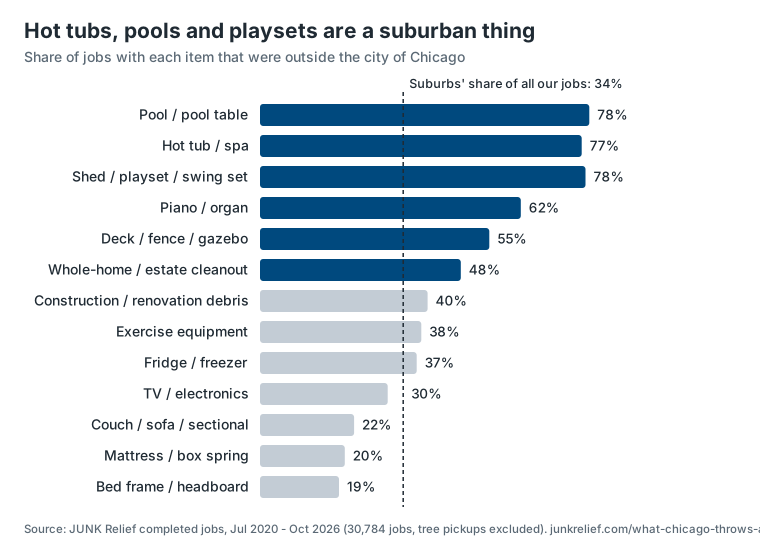
Head past the city limits and the junk moves outdoors. The suburbs make up about a third of our jobs (34%), but 77% of our hot tub removals, 78% of our pool and pool-table jobs, and 78% of the sheds, playsets and swing sets we've hauled. Decks, fences and gazebos lean suburban as well (55%).
Pianos tell the same story. We've carried a piano or organ out of a home on 924 jobs, roughly one every two and a half days. Suburban jobs were nine times as likely to include one as downtown jobs (5.5% versus 0.6%). That makes sense: getting an upright piano into a 30th-floor condo is a project nobody takes on twice.
Chicago cleans out in June
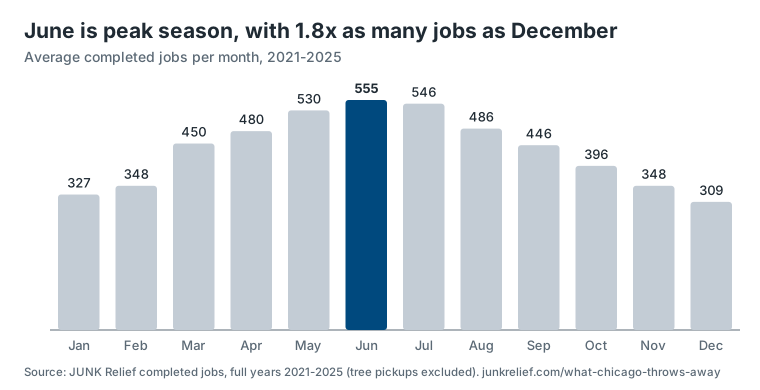
Junk has a season. Averaged over 2021 to 2025, June is our busiest month, with 555 jobs, followed by July (546) and May (530). December is the quietest, at 309, so June runs about 1.8 times as busy.
Spring cleaning is real. Jobs jump about 30% from February (348) to March (450) and keep climbing from there. The New Year's clean-out, on the other hand, mostly waits for warmer weather: January (327) is our second-slowest month of the year.
Outdoor projects follow the thaw. Hot tub removals are about six times as common from April through June as from November through February, and about 60% of them happen between March and June.
Moving day shows up in the data
Most Chicago leases end on the last day of the month, and our schedule knows it. The last three days of each month average 19% more jobs per workday than the rest of the month (18.7 jobs versus 15.6).
Our busiest ZIP codes are on the North Side and the near Northwest Side:
- Lincoln Park (60614): 1,407 jobs
- Lakeview (60657): 1,339 jobs
- Uptown and Andersonville (60640): 1,131 jobs
- Logan Square and Bucktown (60647): 960 jobs
- Wicker Park and Ukrainian Village (60622): 939 jobs
In the suburbs, Naperville (606 jobs) and Evanston (604) are neck and neck, with Oak Park (377) in third.
Goodbye, home gym
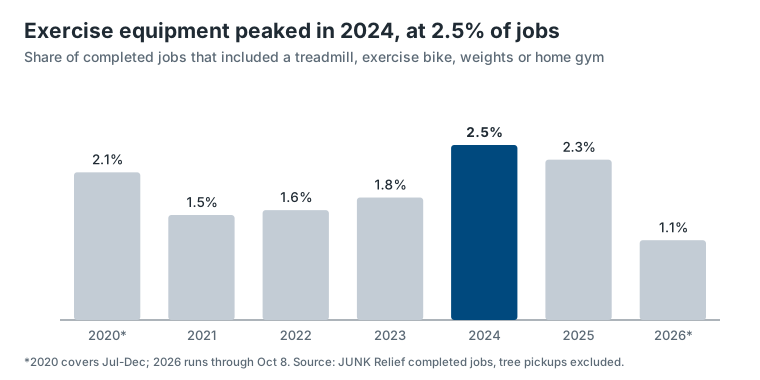
During the pandemic, home gyms moved into a lot of spare bedrooms and basements. Our data suggests many of them moved out a few years later. Exercise equipment, meaning treadmills, exercise bikes, weight sets and home gyms, showed up on 1.5% of our jobs in 2021 and 2.5% in 2024, the highest share of any year we have. 2025 stayed high at 2.3%. Treadmills alone appeared on 276 jobs, and our crew has a lot of respect for every one of them.
If you’ve got a couch with your name on it, we’ve got you covered!
About this data
These numbers come from JUNK Relief’s own completed jobs from mid-2020 through October 2026, not counting our seasonal Christmas tree pickups. Items were counted from the notes written for each job, so the counts are close estimates. Reporters can reach us at joe@junkrelief.com for neighborhood-level tables.